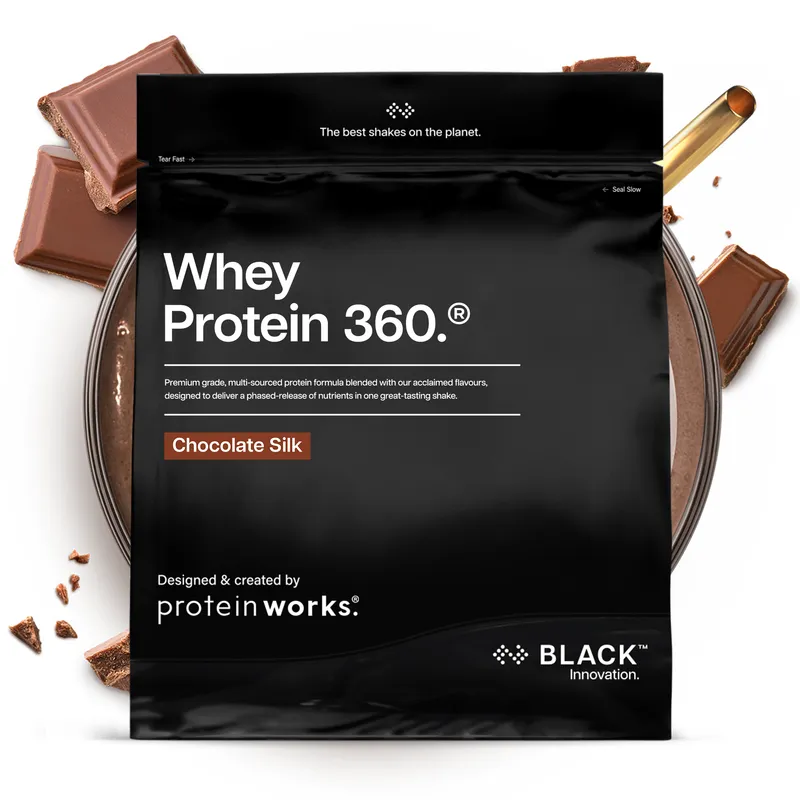
Biggest fall since August
Protein Works
Whey Protein 360 Black
1.2kg bag
Buy Whey Protein 360 Black →Direct from Protein WorksGet 12% off your order
Sixty-one UK protein products changed price by more than 3% between April and August on our own tracking, and two of the biggest brands moved in one direction only. Then we measured again: what has moved since August, and which brands reversed.
Kevin, founder of WheyWise
Biggest fall since August
Protein Works
1.2kg bag
Buy Whey Protein 360 Black →Direct from Protein WorksQuick answer
Between 7 April and 21 August 2026, WheyWise recorded 61 UK protein products changing price by more than 3%: forty went up and twenty-one went down, and every MyProtein and Bulk product that moved went up, while Applied Nutrition held at -0.8%. Since then the direction has split. Comparing the last price we held on or before 21 August with the latest one, across 219 in-stock protein products, 59 rose by more than 3% and 44 fell. Bulk and MyProtein reversed, with all 14 Bulk products and all 8 MyProtein products that moved coming down, and Applied Nutrition went the other way, up on 9 of the 12 products we compared. The clearest fall is Protein Works Whey Protein 360 BLACK, whose 4.8kg bag is 26.5% cheaper in the Protein Works feed than it was in mid-August.
Between 7 April and 21 August 2026, WheyWise recorded 61 UK protein products changing price by more than 3% between observations. Forty of those moves were upward and twenty-one downward.
The interesting part is not the aggregate, it is how unevenly the direction was distributed. Two of the largest UK brands did not have a single meaningful price cut in the window.
| Brand | Products that moved | Up | Down | Average move |
|---|---|---|---|---|
| MyProtein | 4 | 4 | 0 | +18.4% |
| Protein Works | 8 | 5 | 3 | +12.3% |
| Bulk | 7 | 7 | 0 | +10.9% |
| Myvegan | 3 | 2 | 1 | +3.9% |
| Applied Nutrition | 3 | 2 | 1 | -0.8% |
| DY Nutrition | 3 | 1 | 2 | -4.4% |
WheyWise price observations, earliest 7 April 2026 and latest 21 August 2026. Protein categories only. Moves under 3% excluded. Brands with fewer than three moving products excluded as too thin to report.
Across all protein categories, 40 of the 61 moves were upward, which is close to two rises for every fall. The average rise was 18.4% and the average fall 16.4%, so increases were both more common and marginally larger than decreases.
That asymmetry is the finding. A market where prices move up and down in roughly equal measure is a market where sales cycles dominate. A market where rises outnumber falls two to one, and are larger when they happen, is a market repricing upward with promotional noise on top.
It also lines up with what happened to the ingredient. European whey protein concentrate rose about 120% between October 2025 and July 2026, which is covered in what actually drives UK protein powder prices. What this dataset adds is confirmation that the wholesale move reached UK shelves rather than being absorbed by brands.
MyProtein. Four products moved by more than 3%. All four moved up, averaging 18.4%. We did not record a single fall over 3% on a MyProtein protein product in this window.
Bulk. Seven products moved. All seven moved up, averaging 10.9%.
It is worth being careful about what that does and does not show. Both brands run frequent discount codes, and a code does not change the listed price we record, so this measures shelf price rather than what a buyer with a code actually pays. What it does show is that the underlying price these two brands are anchoring to went in one direction across the period, which is the number that a discount is calculated from.
Protein Works was genuinely mixed, with five products up and three down and an average of +12.3%, which fits a brand actively repricing parts of its range in both directions rather than lifting everything.
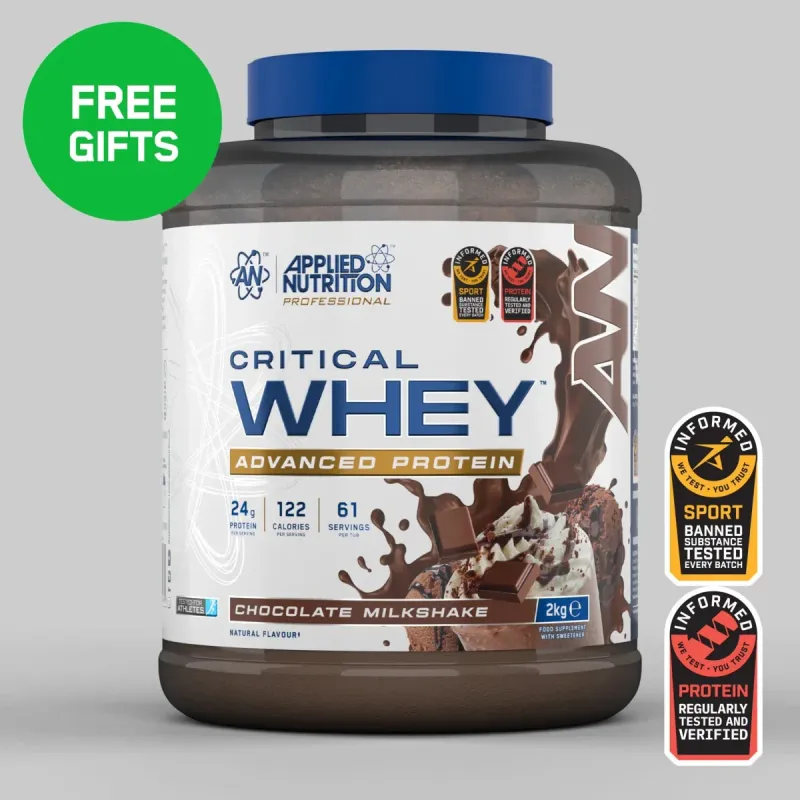
The brand that held until August
825g bag
The one brand in the April to August data whose prices did not net rise, at -0.8% across three moving products, while reporting 57% first-half revenue growth. That has changed since: Critical Whey's 2kg bag on Amazon went from £50.95 to £55.
Buy Critical Whey Protein Powder →See the price on AmazonThe brand that held until August
Pros
Cons
Protein makes up 72%
of this 33g scoop · 128 kcal total
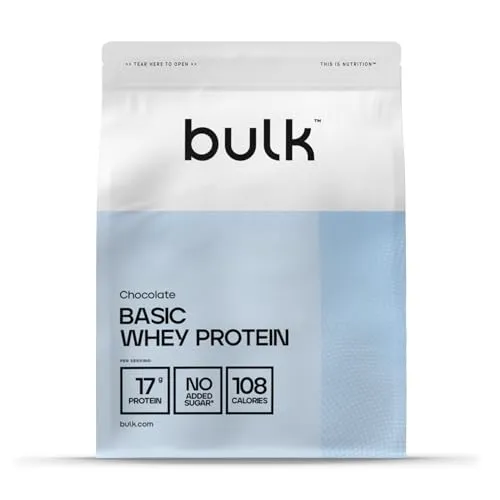
Cheaper than in August
1.25kg bag
Rose with the rest of Bulk's range between April and August, then fell with it. About 59p per 25g of protein in the 2.5kg bag, but read the label first: 56g of protein per 100g, from whey and soy.
or compare all UK prices →Cheaper than in August
Pros
Cons
Protein makes up 56%
of this 30g scoop · 92 kcal total
Applied Nutrition is the answer, and it is a more interesting one than it first looks. Across its three products that moved, two rose and one fell for a net average of -0.8%, which is flat within any reasonable margin.
That happened in the same period the company reported first-half FY26 revenue up 57% to £74.5m and upgraded full-year guidance twice. So this was not a struggling brand discounting to hold volume. It was a growing brand choosing not to pass through the ingredient move, at least on the products we track.
DY Nutrition also netted downward at -4.4% across three products, though from a much smaller base of coverage.
We compare each product's most recent recorded price against an earlier observation at least 30 days older, and report only moves larger than 3%.
The important caveat is the gap between those two observations. Our catalogue scrapers do not run daily, so the interval varies from product to product. Across this dataset it averaged 47 days, with the earliest observation on 7 April 2026 and the latest on 21 August 2026. That is why every figure here carries a window rather than a neat "up 18% in 30 days", which would be wrong for most rows.
Three other honest limits. This measures listed prices, not what someone pays after a discount code. It covers the products we track rather than every SKU a brand sells, so a brand with four moving products is not a brand with four products. And a product that held its price exactly does not appear at all, since we only record moves above 3%, which means the table shows the shape of movement rather than the share of a range that moved.
What it does give you that a market estimate cannot is dated, product-level observations from actual UK retail listings, with both endpoints visible.
Since 21 August the picture has split rather than kept rising. Of 219 protein products we could compare, 59 went up by more than 3%, 44 came down by more than 3% and 116 stayed within 3% either way. The average rise was 17.2% and the average fall 12.8%.
The brands that only moved up between April and August are the ones that have come down since. Every Bulk product that moved, 14 of the 15 we compared, fell, by an average of 11.4%. Every MyProtein product that moved, 8 of 13, fell too, by an average of 10.2%. Applied Nutrition, the brand that held until August, went the other way: 9 of its 12 products rose, by an average of 13.8%, and Optimum Nutrition rose on 7 of 8.
| Brand | Products compared | Up | Down | Average move, products that moved |
|---|---|---|---|---|
| Bulk | 15 | 0 | 14 | -11.4% |
| MyProtein | 13 | 0 | 8 | -10.2% |
| Applied Nutrition | 12 | 9 | 0 | +13.8% |
| Optimum Nutrition | 8 | 7 | 1 | +10.0% |
| PER4M Nutrition | 9 | 4 | 2 | +9.2% |
| DY Nutrition | 6 | 3 | 1 | +11.7% |
| Protein Works | 11 | 2 | 2 | -2.1% |
| MaxiNutrition | 6 | 3 | 0 | +18.6% |
| Sci-MX | 4 | 3 | 0 | +12.9% |
WheyWise price records. Earlier observation: the last price recorded on or before 21 August 2026, which fell between 14 and 21 August. Later observation: the latest price recorded between 24 September and 4 October 2026. Protein categories only, products in stock at the later check. A move is a change of more than 3%. Brands with fewer than three moving products left out.
A few of the moves behind those numbers. Bulk Basic Whey's 2.5kg bag on Amazon went from £35.99 to £32.99, and Bulk Micellar Casein's 2.5kg bag from £67.99 to £56.99. On Myprotein's own site, Essential Whey in the 2.25kg bag went from £68.49 to £55.99. Going the other way, Applied Nutrition Critical Plant in the 1.8kg bag on Amazon went from £28.71 to £35.98, and Optimum Nutrition Gold Standard 100% Whey in the 2.27kg tub from £87.95 to £96.02.
Protein Works was split down the middle. Whey Protein 360 BLACK fell sharply, with the 4.8kg bag going from £84.99 to £62.49 in the Protein Works feed, a 26.5% fall, while Vegan Protein 360 BLACK went up, with the 4kg bag going from £51.99 to £66.49. Both figures are the feed price on both dates, which on some Protein Works products is the OnTap subscription price rather than the one-off price, so the comparison is like for like.
How we measured this. For each product, retailer and pack size, we compared the latest price recorded in the ten days to 4 October 2026 with the last price recorded on or before 21 August. We only counted variants with a record on both sides, dropped any whose last record before 21 August was older than 14 August, and only counted variants in stock at the later check. That gave 990 variants across 420 product, retailer and size combinations, covering 219 products from 78 brands. Where a product had several flavours we used the cheapest, and where it had several sizes or retailers we took the median move across them. Two non-protein items filed under protein categories were left out.
The same limits as the earlier window apply: these are listed prices, not what you pay with a discount code, and they cover the products we track rather than whole ranges. One more is specific to this window. Most of the observations, 298 of the 420 combinations, are Amazon UK listings, where the price can be set by a third-party seller rather than the brand.
Three practical conclusions.
Brand loyalty can cost you either way. If you have bought the same MyProtein or Bulk product for three years, the price you are anchored to is out of date. Between April and August it only moved up, and since August it has come back down. Re-check against the current market rather than against your memory.
The spread between brands now matters more than the trend within one. An 18% rise on a product is unwelcome, but the gap between the cheapest whey we can verify, NutriSport Whey Protein Isolate at about 46p per 25g of protein, and Optimum Nutrition Gold Standard at £1.23 is far larger than any single year's movement.
Check before every repeat purchase, not every year. With observations averaging 47 days apart and moves averaging 18% when they happen between April and August, and 103 of 219 products moving by more than 3% in the six weeks or so after 21 August, a price you checked two months ago is genuinely stale.
You can see what is moving right now on the protein price tracker, rank the whole market on the cheapest protein comparison, or check any product against the bands in how much protein powder should cost. For which brands are worth buying beyond price alone, see UK protein brands worth buying, and to compare two products directly use the protein comparison tool.
On WheyWise tracking between 7 April and 21 August 2026, every MyProtein product that moved went up, an average of 18.4% across four products, and every Bulk product that moved went up, an average of 10.9% across seven. Protein Works was mixed with five up and three down. Applied Nutrition was roughly flat at -0.8% across three products. Since August the risers have been different brands: Applied Nutrition went up on 9 of the 12 products we compared and Optimum Nutrition on 7 of 8.
Some have. Comparing the last price we recorded on or before 21 August 2026 with the latest one, across 219 in-stock protein products, 59 rose by more than 3%, 44 fell by more than 3% and 116 stayed within 3% either way. Bulk and MyProtein, which only moved up between April and August, came down: all 14 Bulk products and all 8 MyProtein products that moved fell, by an average of 11.4% and 10.2%.
Mostly up. Of 61 UK protein products we recorded moving more than 3% between observations across 2026, 40 rose and 21 fell. The average rise was 18.4% and the average fall 16.4%, so rises were both more frequent and slightly larger. Observations averaged 47 days apart.
On our tracking, yes, and consistently. All four MyProtein protein products that moved by more than 3% between observations moved upward, averaging 18.4%. We did not record a single fall of more than 3% on a MyProtein protein product in this window. That is measured shelf data on the products we track, not a statement about the brand's entire catalogue. Since August the direction has reversed: all eight MyProtein products that moved by more than 3% between the last price before 21 August and the latest one came down, by an average of 10.2%.
Applied Nutrition held between 7 April and 21 August, of the brands with enough movement to be worth reporting. Across the three products that moved, two rose and one fell, averaging -0.8%, which is effectively flat. That coincides with the period in which the company reported first-half FY26 revenue growth of 57%. It has not held since: comparing the last price before 21 August with the latest one, Applied Nutrition went up on 9 of the 12 products we compared, by an average of 13.8% among those that moved.
We compare the most recent recorded price for a product against an earlier observation at least 30 days older, and report only moves larger than 3%. Because our catalogue scrapers do not run daily, the gap between the two observations varies: across this dataset it averaged 47 days. That is why every figure here carries both dates rather than a single time period.
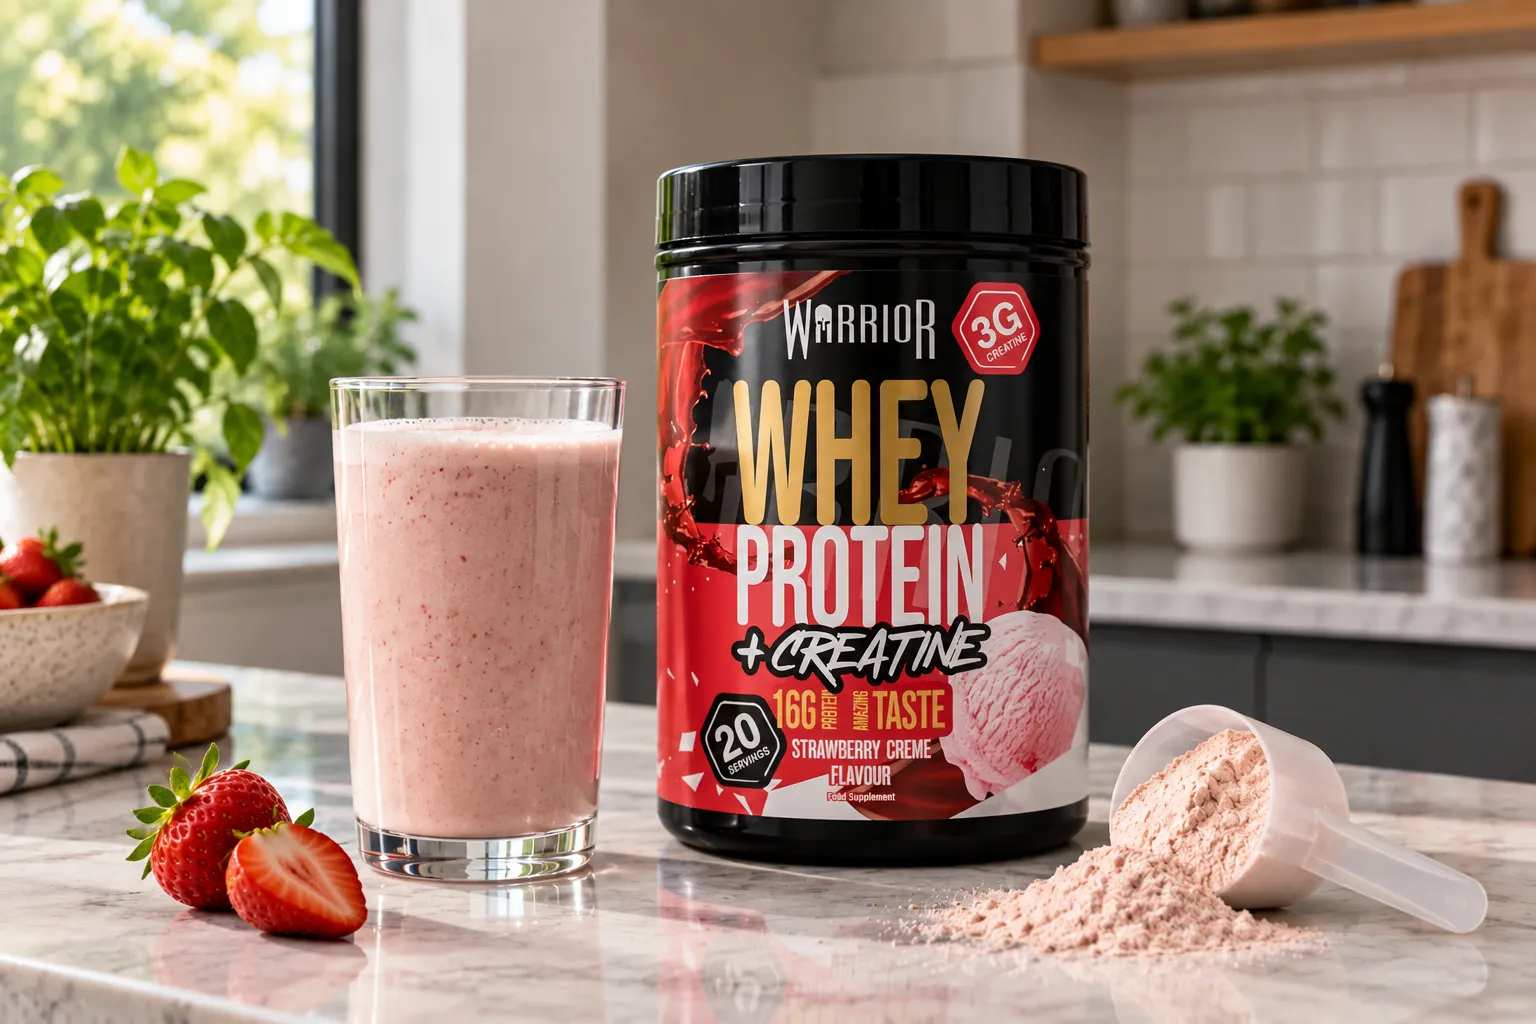
Is Warrior Protein Expensive? What Warrior Whey Costs Per 25g of Protein
Warrior Whey costs £1.16 per 25g of protein in its cheapest in-stock bag, and its cheap 1kg and 2kg sizes are sold out. What Warrior costs per scoop, how it compares with Myprotein, Bulk and Optimum Nutrition, and the cheaper Warrior protein most people miss.
8 min read
Is PhD Protein Expensive? What Diet Whey Really Costs Per 25g of Protein
PhD Diet Whey costs £1.13 per 25g of protein in its cheapest 2kg bag, and carries less protein per 100g than a plain whey. What the price buys you, what Smart Protein costs, and when PhD is worth it.
8 min read
How Much Should Protein Powder Cost in the UK?
What counts as cheap, fair and overpriced for protein powder in the UK, in pounds per kilogram and per 25g of protein. Plus why the per-kilogram figure everyone quotes is the wrong one to judge on.
8 min readFind your cheapest protein
717 products compared from 180 brands
Sorted by best value per 25g of protein.
Compare all products